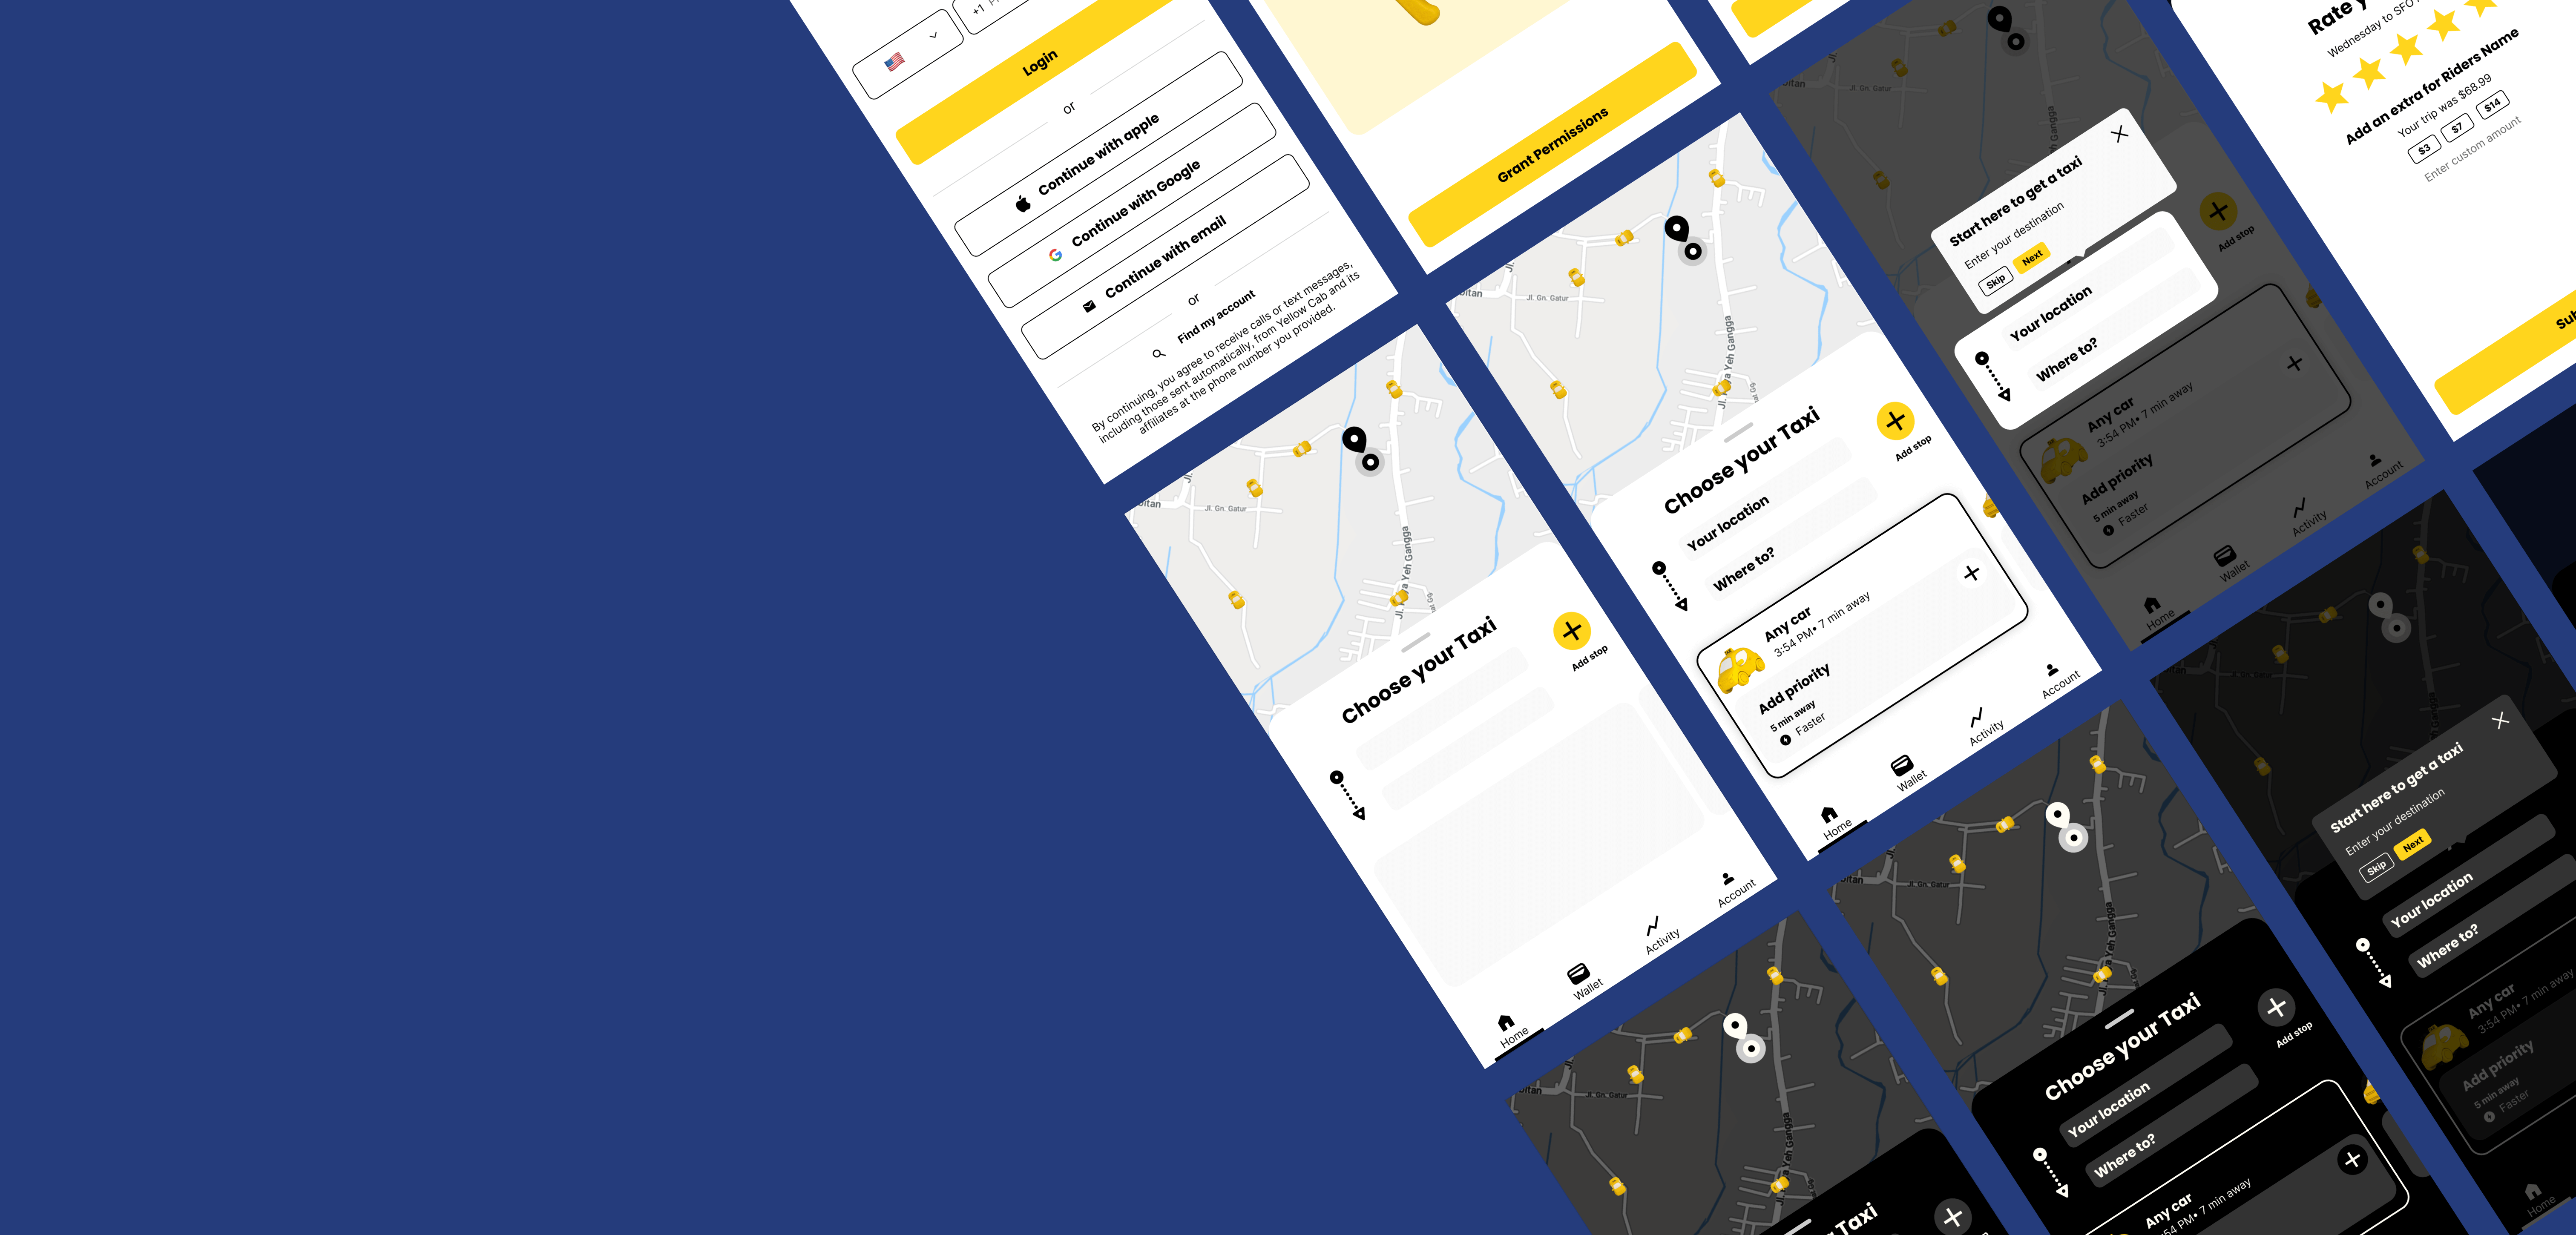
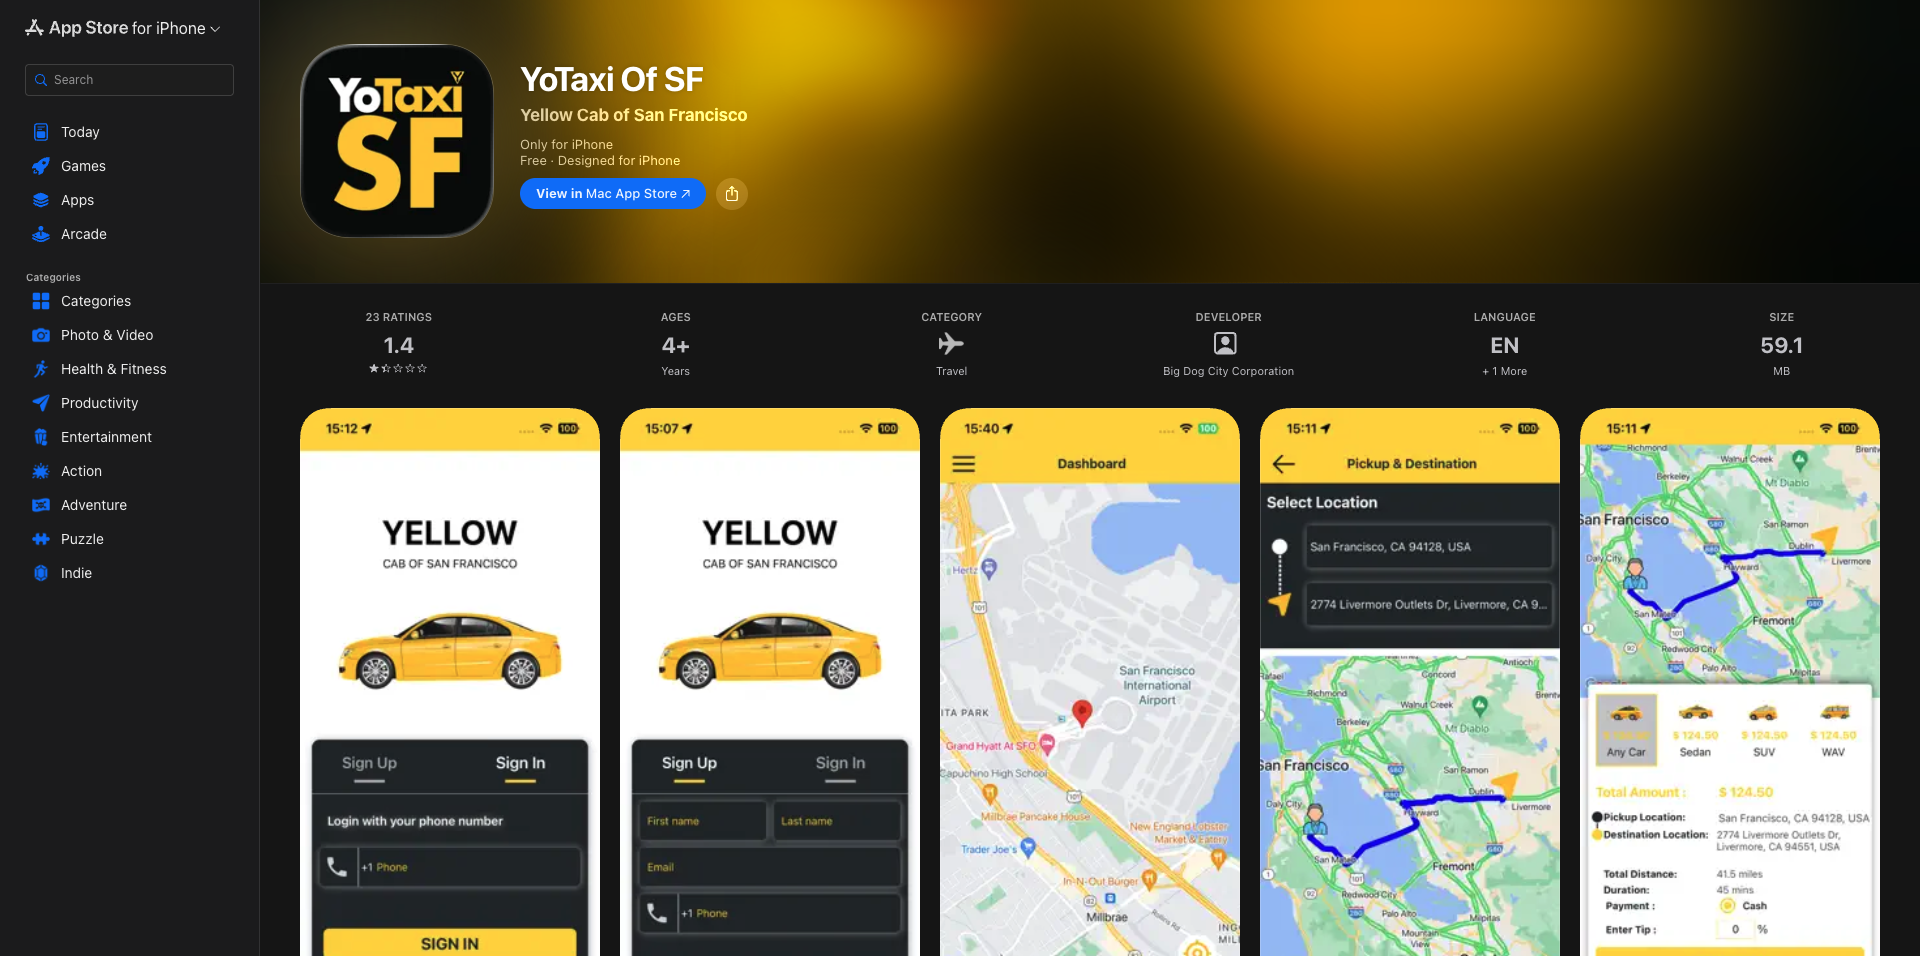
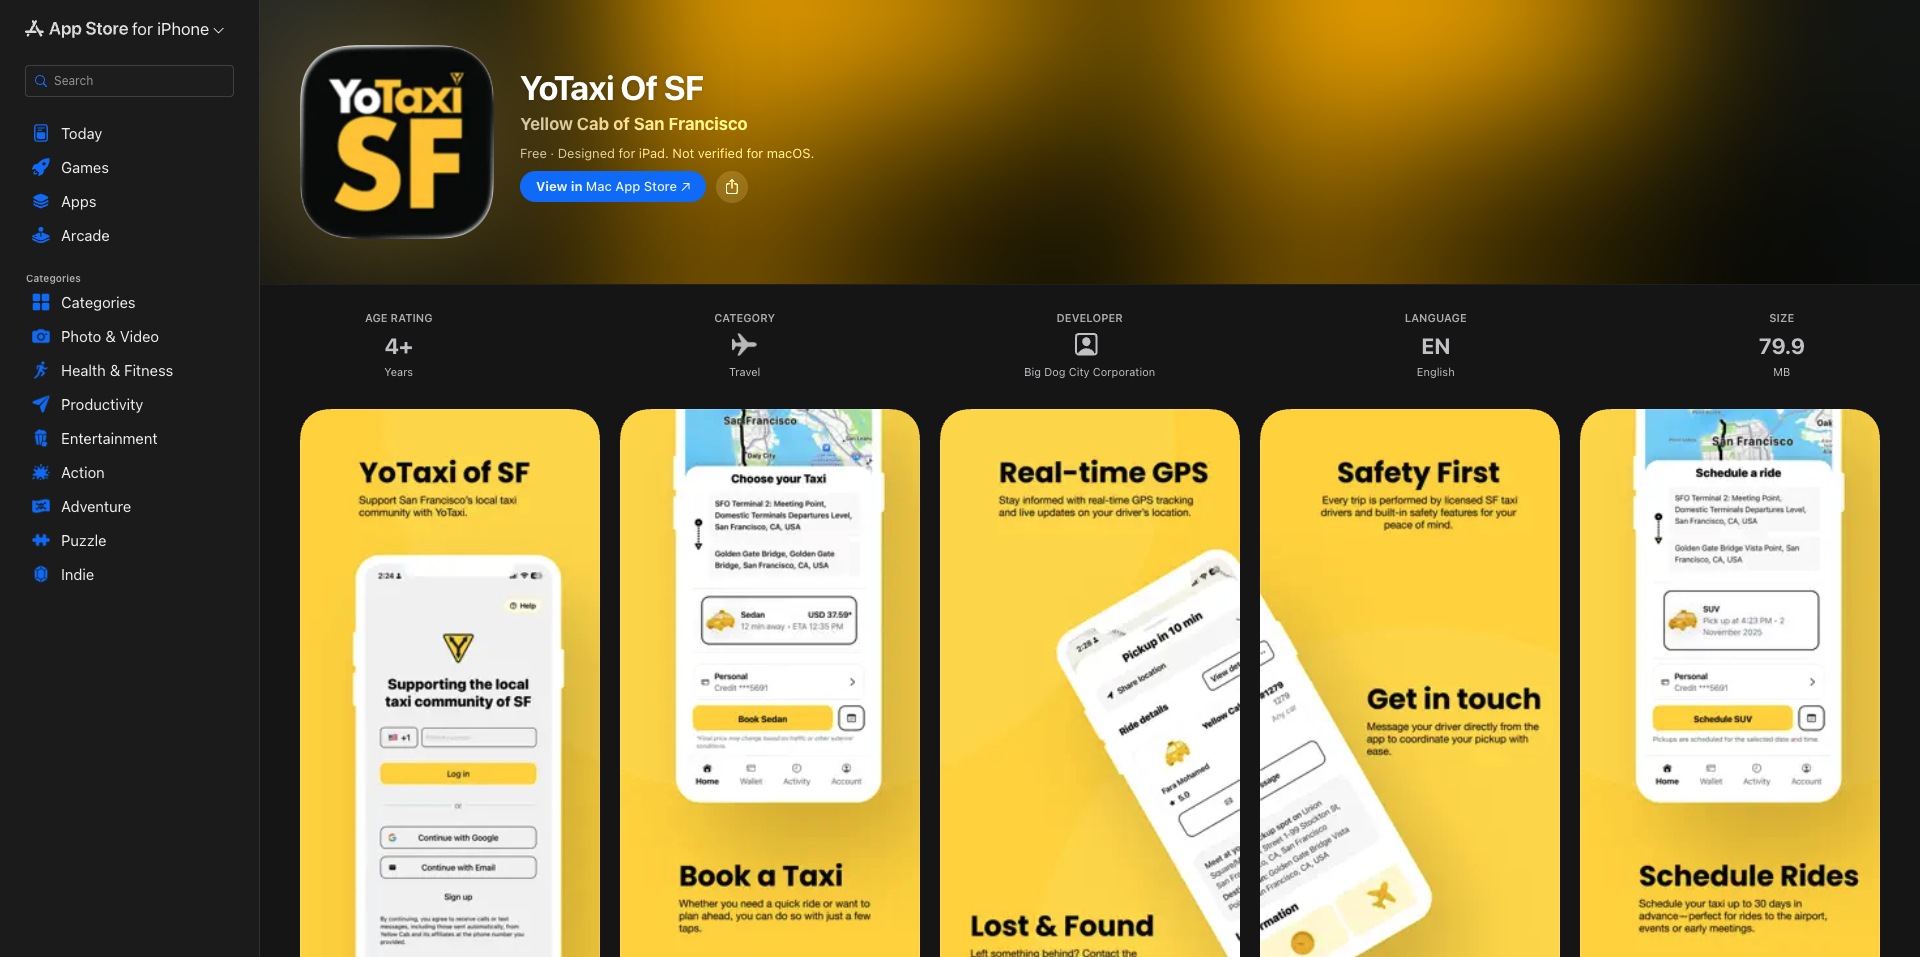
I designed, prototyped, and developed the new YoTaxi app
while improving the user experience through Design Thinking methodologies. I collaborated closely with
stakeholders and other developers to align solutions with both user and business needs, and conducted remote
usability studies, led
user research, and developed personas. I also ensured accessibility best practices across all products,
created low- and high-fidelity prototypes using Figma, and handled both front-end and back-end development
using React Native, TypeScript, Express.js, and AWS.
Case Study
Project Overview
The Problem
Many passengers in San Francisco found it difficult to access reliable,
inclusive, and user-friendly taxi
services. The existing app lacked clarity, accessibility, and modern functionality—leading to frustration and
low user satisfaction.
The Goal
Design and develop an intuitive mobile application that simplifies the ride-hailing
experience, improves
accessibility for all users (including those with disabilities), and supports the local taxi community by
making YoTaxi a competitive and easy-to-use alternative.
My Role
User Experience (UX) Designer and Developer.
Responsibilities
Conduct user research
Identify pain points
Ideate solutions
Create wireframes
Conduct usability studies
Develop prototypes
User Research
Summary
User research with over 50 participants revealed that riders wanted more control
and personalization in their
experience. Key requested features included: the ability to add a stop during a ride, set accessibility and
payment preferences, choose music and conversation settings, message the driver, and receive real-time
notifications about their ride status.
User Personas
Linda
"I just want to feel safe and know that my ride is reliable. I rely on
these services to get
around."
Goals
Get to medical appointments and run errands efficiently.
Ensure the ride is affordable and safe.
Frustrations
Inconsistent driver professionalism.
Difficulty navigating the app to book a ride.
Linda relies on YoTaxi for doctor visits and errands.
She appreciates scheduling rides but
struggles with the app’s interface and has missed rides due to booking errors. She values kind drivers
and would feel safer with an emergency feature.
Information Architecture
(Click on image to enlarge)
Paper Wireframe
(Click on image to enlarge)
Low-fidelity Prototype
(Click on image to enlarge)
High-Fidelity Prototype
(Click on image to enlarge)
Sticker Sheet
I added a Sticker Sheet to make it easy to develop the app's unique components
and styles.
(Click on image to enlarge)
Accesibility
To prioritize accessibility, YoTaxi includes language toggle options to
support users from different regions,
as well as light and dark modes for visual comfort. The interface features prominent headers and alt text for
images to ensure screen reader compatibility, enhancing usability for visually impaired users. These features
make the app more inclusive and user-friendly for a broader audience.
Before And After
Sentry: Error Monitoring & Event Tracking
Sentry was integrated into the YoTaxi app to monitor real-time errors
and track key user events across both iOS and Android platforms. Rather than guessing what broke or why users
abandoned a flow, Sentry provided direct visibility into the app's behavior in production — giving the team
a data-driven foundation for every improvement cycle.
Key Metrics Tracked
Ride Creation: Custom Sentry events were instrumented at each step of the booking flow —
location selection, pickup confirmation, driver matching, and ride start — broken down by platform. On iOS,
a timing issue during driver matching caused a brief screen freeze. On Android, a geolocation permission
error was silently blocking ride creation for a subset of users.
Ride Cancellation: Cancellation events were tracked with context — user-initiated, driver
cancellation, or system timeout. Comparing cancellation rates by platform revealed that Android users were
dropping off significantly more at the driver-matching step, which led to a redesign of the waiting screen
with clearer status feedback and an estimated wait time.
Ride Duration: Session duration was tracked from ride start to completion per platform.
Android sessions averaged 15% shorter than iOS — a pattern that correlated with a higher rate of premature
app closures. Sentry breadcrumbs traced this to a background process killing the app on lower-end Android
devices.
Improvements Driven by Sentry Data
Fixed a driver-matching freeze on iOS that reduced the crash rate by 40%.
Redesigned the Android waiting screen after identifying high cancellation drop-off at that step.
Resolved a background process bug on Android causing premature session termination.
Prioritized accessibility fixes on Android after Sentry revealed higher error rates for users with screen
readers enabled.
Let's get in touch
Have a project in mind? Let's build something great together!